Thursday, November 8, 2012

Copying On S3

The question recently arose: Is it faster to copy within buckets on S3 than it is to copy between buckets?

A quick script provided an answer. I copied a 100K file 100 times for each test and averaged the results (which are in seconds).


Avg. time to make copy between buckets: 0.10705331
Avg. time to make copy within bucket: 0.10522299

A second test produced similar results (very slightly slower in both cases).

And here's the Ruby script I threw together. It uses the aws-sdk gem.


# get buckets
s3 = AWS::S3.new
bucket1 = s3.buckets['dfsbucket1']
bucket2 = s3.buckets['dfsbucket2']

# get an object from bucket 1
random_file = bucket1.objects['191111308/state_file']

start = Time.now
copies = 100
(1 .. copies).each do |i|
  random_file.copy_to("test_file#{i}", {
     :bucket => bucket2
  })
end
puts "Avg. time to make copy between buckets: #{(Time.now - start)/copies}"

start = Time.now
(1..copies).each {|i| random_file.copy_to("test_file#{i}")}
puts "Avg. time to make copy within bucket: #{(Time.now - start)/copies}"


Sunday, November 4, 2012

Grokking Graphite


We started using Graphite at work six or so months ago, largely because there was already support for it in the metrics library we're using. If you don't know Graphite, it's a system for accumulating and, obviously, graphing time series. Most people use it for systems monitoring.

When we first set it up, I played with a few graphs of key metrics over time. Pick the metric from a list; Graphite shows you the graph. Easy. I also set up some basic dashboards that showed a few graphs. Again, easy.

But that's not always all you need. I wanted larger pictures of the whole system: hot spots, accumulated data across servers (in our setup, each server is its own metrics hierarchy in Graphite), and more. I pondered various ways to get the data out of Graphite (which it supports) and into R.

Then I discovered its functions library. And I went crazy.

First was a graph that showed every call in our system over a certain time threshold.

Then came one that combined a number of metrics to estimate mean time to first byte, a common metric for website performance.

And then another. And another. These days, I set up my laptop to run Chrome in full-screen mode so that it can fit all the graphs on one of my dashboards. But that's just one tab: I have dashboards for different environments and dashboards that focus on subsystems within those environments. A graph showing our 10 slowest calls gets uploaded to Campfire each day.

Our ten slowest calls as of today, with proprietary information removed. The lines are flat because of lack of activity on the server.


So far Graphite — especially version 0.9.10 — has been able to keep up with almost all my needs, and I haven't even hit all the functions. It even has a command-line interface that I just started playing with. (It allows faster iteration and finer control over each graph in a dashboard, but also allows you to keep a dashboard-building script under source control.) There are also a wide range of tools that work with it (including, of course, my own metrics relay system).

When I first read Graphite's documentation, I was struck by the author's right-up-front advice to consider your metrics naming scheme carefully. It seemed very nitty-gritty so early in the manual.

But now I understand. A consistent naming scheme and hierarchy depth allows for much simpler construction of useful graphs. To some extent, our profiling code, our package hierarchy, and our metrics library give us this for free. But the other day I realized I had made a mistake in naming a metric that captures all invocations of methods with a particular annotation, and it made it much more difficult to assemble a meaningful graph. I got it to work, but it required some wrestling. If you're using Graphite, I recommend auditing your metrics periodically to make sure you can get the most out of them.

Sunday, September 16, 2012

Tsung vs. JMeter

I first learned of tsung from a colleague in EA's Pogo division, and I was intrigued by his description of the load it could generate. I've been pushing it at Maxis as a result.

There's sound architectural reasoning for its abilities. It's written in Erlang, which delivers highly concurrent systems by eschewing the use of threads in favor of events. The various Java-based loadtesting tools use threads to simulate users, which necessarily limits their abilities.

There's also good anecdotal evidence favoring tsung, not only from the Pogo folks but also from the fact that it's used to loadtest ejabberd, the chat system Facebook uses that is generally considered to be the most scalable around. (It's also written in Erlang)

But how much better is it than JMeter, the go-to Java-based loadtesting tool? JMeter is probably easier to configure -- it has a GUI versus moderately documented XML -- and it probably has a richer feature set. So is it worth going to tsung?

There are some numbers out there, such as this slideshow, which found that tsung could generate up to 50,000 simultaneous users while JMeter couldn't go above 1,000 requests per second, but I wanted to find out for myself.

I set up a simple web server (mochiweb, an Erlang-based web server that also has a good scalability track record -- sensing a pattern here?) that served a simple, static page. Remember the goal wasn't to test the server under load; it was to test how much load the clients could generate. I also ran top to get a sense of how much CPU my process was using. There are probably lots of things wrong with my methodology, but, again, I just wanted a sense of the difference.

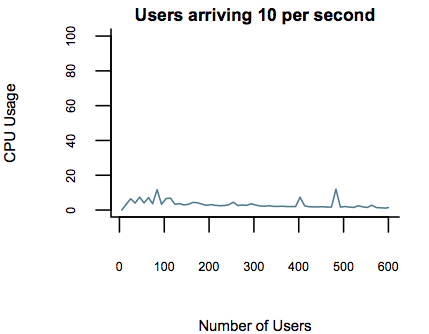
Here's some graphs I made comparing CPU usage by tsung for given rates of users. This was on my MacBook Pro with a minimal set of other applications open.

Note that the numbers on the x-axis show the number of users up to that point. The web server responds very quickly in this scenario, so the number of simultaneous users is probably very small.

Tsung Graphs


And here are the graphs I could collect from JMeter, which I configured via the GUI and then ran in command-line mode. Once I tried to get to 100 users per second, the JVM never had enough memory to create all the threads, no matter how I adjusted the heap size. This is, of course, the other major resource that threads consume.

So tsung, even on my machine, could handle about 50 times more users than JMeter, which is roughly consistent with the numbers in the report I link to above. That said, for tiny amounts of load, JMeter compares favorably with tsung and is a lot quicker to get up and running. 


JMeter Graphs


I've noticed a tendency in Java shops to rely solely on tools written in Java. It drives me crazy; why put blinders on to a big chunk of software universe? I (more or less) like Java; I use it all the time. But it's not good for everything, and it's worth knowing what else is out there that might be better at solving the problem at hand. 

Yes, tsung is "harder" than JMeter. It's written in another language. Boo hoo. Use the tool that makes sense; in this case it's hard to argue with tsung's capabilities.

Friday, August 31, 2012

metricsmaw

Web applications have always been heterogenous environments -- Apache or Nginx talking to PHP or Java which is talking to MySQL or Oracle. But these days, it seems like the number of potential components in a system has exploded. And those components, often drawn from the front lines of new tech, come with different levels of maturity.

That realization happened again as I evaluated node.js at work and wanted to capture metrics about the system. How many of X could node.js do versus a Java version? And it's occurred to me at home when working with Ruby, Erlang, or Scala. I can't always get the metrics I want from the environment I want in a consistent way.

So I wrote a program to fix that. For lack of a better name, I called it metricsmaw, and I checked the very early version into github.

metricsmaw is an Erlang server that does one thing: It receives data into metrics and relays those metrics to other places. Currently, the other places are csv files and a Graphite server. The metrics it supports right now are counters, gauges, and a by-the-minute rate meter that provides rates for the last minute, the last five minutes, and the last 15 minutes. Metrics and reporters are set up as Erlang behaviours so I can add new ones easily.

While this solves a problem I often run into, it's also a good chance to flex my Erlang muscles and dig more into a language and environment I'm really enjoying. Erlang seems like a good fit here, as it excels as long-lived software that needs to be fault-tolerant and highly concurrent.

And since I first thought of this in the context of node.js, I added a node.js library for talking to it. I haven't really dug in to the node.js idioms, so it doesn't handle, say, disconnected sockets very well, but it solves the basic problem.

Wednesday, May 30, 2012

Packing bytes with templates

I recently came up with a little tool that solves a tangential problem we have.

We're building a binary protocol for talking to our servers. We have some initial work in place, and I have a battalion of little functions for creating a byte array from a number, creating a number from a byte array, etc. For a given message in the protocol, you need to compose a byte array to send over the wire, so you might write out a header, an ID or two, and maybe some other stuff.

Something like:
public byte[] createJavaInterestingMessage(Long id, String message) {
      ByteArrayOutputStream bos = new ByteArrayOutputStream();

      writeHeader(1234,bos);

      writeLong(id,bos);

      writeText(message,bos);

}

We had our first case working when the game-side engineer I'm working with said he wanted additional data in the message. Easy enough to add, but I was reminded of erlang's bit syntax. You can create elaborate binary data with a concise syntax that says, effectively, "create a binary blob by writing this variable into the first 3 bits of the binary, this variable into the next 15 bits, etc."

Something like:
ErlangInterestingMessage = <<Var1:3,Var2:15>>.


Wouldn't that be nice? No adding another call to writeLong just for another value. I could just write out the structure I wanted. I didn't care about the bit-level specification that erlang offers, but specifying byte lengths is valuable. If you know a particular int value is never going to go above 65,000, you can encode it in just two bytes, not four. Compare that to Java's built-in DataOutput classes; they always write an int into four bytes.

There's another benefit. Tell me quickly what the format of JavaInterestingMessage is. Now tell me quickly what the format of ErlangInterestingMessage is. One documents itself; one requires a bit of digging.

Other tools, notably Google's protocol buffers, solve this problem in various ways, but many of those were overkill for what, in my case, is just a simple template.

If you're a Java programmer, you might be envisioning something with StringTokenizer and/or regular expressions to parse my little template. I thought about those, but I didn't want to fritter away time trying to get a regex just right or handling funny little edge cases. I decided to use antlr to generate a parser for me. Antlr is a tool that generates parser code based on a language spec. The language spec is written in a language designed for defining language specs (if that doesn't make your head hurt a little), but antlr lets you insert some Java (or other language) into the language spec so that your parser can collect information along the way for you.

I had to refresh my memory of using antlr, but within an evening -- this is incidental work, so I did it after hours -- I had a parser up and running. I shamelessly lifted from erlang's syntax, only replacing the comma with a pipe. The system has two pieces: the parser generated by antlr and some Java code for translating the parsed template into an actual byte array. I can generate a byte array from a List of objects, an array of objects, and a map of objects keyed by String. And because antlr does all the work of making the parser, I allowed for white space and various other freebies such as requiring that you only use positions or field names, not both.

Now you can do stuff like this:

// writes item 0 of list into the first two bytes of the array and writes item 1 into however many bytes it needs
pack(list, "<< $0:2 | $1 >>"); 

 // writes the "id" item of map into however many bytes it needs and then the "flag" element into the next byte.
pack(map, "<< $id | $flag:1 >>");

Right now, I support longs, ints, and byte arrays, but I have plans to support arbitrary data with type converters that can go from one type (Date, say) to another (long, say). (This is inspired by Scala.)

Once I had data packing working, I realized that my parsing of incoming binary data now seemed grotesque. Figure out offsets into byte arrays, do bit-shifting and bitwise comparisons as needed, yada yada yada.

Naturally, I wanted to use my same templates for unpacking data.

That's a trickier problem. Bytes are just bytes; if one says 65, are you supposed to interpret it as 65 or as "A"? But erlang has a syntax for that as well; you can specify a data type of the bytes you've unmarshalled with "/" followed by the data type.

As of tonight, my little template language supports the same thing. You can now do something like:
unpackIntoMap(byte[] data, "<< $id:8/long | $text >>"); // treats the first 8 bytes as a long that is put into the "id" field of a map and consumes all the rest of the data and stores it in the map as a byte array keyed by "text"


and get back a Map populated as you want. With, again, the expected format being very easy to see.

I expect this to save a lot of programming and debugging time as we move forward with our protocol, but it was also fun to play with creating a custom language (however small) to reduce boilerplate code.


Saturday, May 12, 2012

Functional Programming For The Imperative Mind

I've been learning erlang on the side lately, largely because of its increasing role in the universe of scalable systems. I know of a number of highly-scalable pieces of software that are written in erlang. But I also think that shifting programming paradigms every now and then is a good mental exercise.

I've mentioned before that I often write word puzzle solvers (for puzzles you might find in the National Puzzlers' League newsletter) when learning a new language. It's a problem I understand, it doesn't involve a lot of error handling or user interface, and you have to think a little about scale because wordlists can be reasonably big. I'm doing the same with erlang, but I'm focusing on writing a cryptogram solver.

Getting the gist of the language wasn't too difficult, but I struggle with thinking in functional terms. How do I take a problem that I know how to solve in an imperative language such as Java and translate it into functional patterns? It's fine that one can code a Fibonnaci sequence so quickly, but how often do you need to do that in a production system?

I asked some functional programming fans at work, and they gave me some ideas.  "Functional Programming for the Rest of Us" is a six-year-old post that recently made the rounds on Hacker News. It trumpets the benefits of these languages but didn't help me with my problem. Various books on algorithm design were also suggested, because functional programming is really derived from lambda calculus. While I'm looking at those, that obviously increases the friction to learning. It's not as if I'm writing business-critical software in erlang yet, so increasing the work to learn it seems like a good way to let it fall by the wayside.

I still haven't found a good single resource for my not-so-unique situation, but I've begun to piece together a strategy based on bits here and there. The paper "Why Functional Programming?" got me focused on decomposing programs into smaller and smaller bits. That's a good strategy in imperative programming, too, but I've found with functional programming that I need to brunoise my ideas, not just dice them. O'Reilly's Erlang Programming articulated something that I had to begun to come to myself: accumulators. It's hard for me to think of building up a list from the end out, but it turns out I can easily picture how to do it by passing values down through the recursive calls and then returning that list of values when I'm at the end of the chain.

That technique has a benefit: You often naturally end up with tail-recursive code. But I worry it's becoming too much of a crutch for me. Because I can easily think in those terms, it's the technique I often use. I write a "pretty" function for clients of the code, and that largely calls down to a function that uses accumulators to compose a return value.

Are there other good resources for programmers in my situation?

Saturday, April 7, 2012

R

We're getting more focused on analyzing data for SimCity. Telemetry (gameplay analytics) and server metrics are both getting some attention from the team. There are lots of tools to help with this, from real-time graphing systems such as Graphite to the venerable Excel.

But working on SimCity has given me a taste for interesting forms of data visualization. The standard charts serve a purpose, of course, but working on the game has exposed me to newer developments in the visualization field. We're always passing around this or that interesting visualization from the Internet, because showing data to the player is one of the core things we have to do.

We're trying, as often as we can, to put the data a player cares about in the game world. The most extreme form of this comes from what the game's simulation engine, GlassBox, can give us. Everything going on in the world is tied to what's really happening in the engine, not some statistical abstraction as in previous SimCity games. A puff of smoke from a factory isn't just an effect; it's actually a cue that we have written to the pollution map. I like to say that our game is the ultimate data visualization.

Inspired by all this, I started learning R, a language for statistical data analysis and presentation. Along with being tailored for this purpose, it can also be run in batch scripts, which will be a key feature as we automate reports about various aspects of system activity.

I first learned of R when reading Nathan Yau's  Visualize This, a book I recommend for getting your hands dirty with practical data visualization. Unfortunately, the nature of his book allows for little more than a cursory explanation of R. 

This time around, I picked up R In Action, a much deeper look at the language. While a good chunk of the book is aimed at people who remember their statistics better than I do, the introductory chapters will give you the basics of slicing and dicing data and presenting it in a useful form.

Here's one visualization I did about some data from a focus test. I've stripped off the titles, and I'm not going to say exactly what's going on here (NDA and all that), but the gist is that it's a particular facet of player activity we were measuring during the focus group. The darker the color in each graph, the more players who did that activity in the time frame specified. The taller the the boxes, the more players overall who did it. Each graph represents a particular subset of that activity. (See small multiples)
I had a few goals with this visualization. One, obviously, was to apply R to a real-world problem so I could learn it better. Another was to push it outside of the realm of bar charts and line graphs. Obviously it can do those, but so can everything else on the planet. If I'm going to be inspired to do interesting visualizations, I want a language that will support me.

I came away impressed. R has specialized data structures that make it easy to throw data around in any old way. The standard install was able to do everything I wanted, though a number of packages make various pieces even easier.

The code to prepare that visualization is on the order of 50 lines. (And that's without any real experience with the language.) Calculating the quantiles that make up the gradient? One line. The actual graphing work? Ten lines. Most of the work, as is always the case, was just cleaning and prepping the data. How many lines would it be in Ruby? Or, god forbid, Java? 

As powerful as R is, it's also maddening. It's a language designed by and for academics, so it lacks a lot of the niceties that you find in more widespread languages. Functions are haphazardly named, based on the whim of whatever grad student added it back in the day. The documentation is quite good if you know what you're looking for, but frustrating if you want to query it more abstractly. Some large percentage of my current R knowledge comes from Stack Overflow, the end point of seemingly every query about R in Google. 

Still, if analyzing data is part of your job, R's a powerful tool. It can work with large data sets (and there are packages that let it work with very large data sets), and you can quickly aggregate and manipulate data to understand it better.